My social algorithm may be broken. Lately I’ve been seeing a flood of sentimental posts lamenting how “kids these days” wouldn’t survive back in my day. Depending on the author, “my day” ranges anywhere from the 1950s to the 1990s, but the punchline is always the same: We were tough. Today’s kids are soft.
Those posts got me thinking about my own childhood in the late 1980s and early 1990s. One photo in particular comes to mind, taken when I was maybe three or five years old. We didn’t have a pool, so in the heat of a Northeastern summer, my parents would fill a five-gallon bucket with water and plop me in. Submerged up to my neck, surveying the backyard from my makeshift infinity pool, I felt like I was living in peak suburban luxury.

What stands out about that photo now is what’s missing: the ubiquitous drowning-hazard warning label. And that absence wasn’t just cosmetic. Between 1985 and 1987, there were 67 toddler drownings in buckets, enough to get the U.S. Consumer Product Safety Commission’s attention. By the mid-1990s, the bucket industry was funding an education campaign and adding labels and calls to regulate the industry were beginning to subside. At the time, about three toddlers a month were dying this way. Not an epidemic, but devastating if it’s your child.
That’s how safety regulation usually unfolds in the US: slowly, reactively, and in response to tragedy. Which makes me wonder; how effective are these efforts to reduce accidental deaths, particularly in children? Yes, there’s always a tension with personal liberty, but what have we actually gained from seatbelts, airbags, bike helmets, crib safety rules, and yes, even bucket labels, over the past fifty years?
The 10,000-Foot View of Death in America
Every country has its own mortality fingerprint. Income, culture, diet, genetics, and even politics all shape what kills us. In the U.S. in 2023, the top three causes of death were:
- Heart disease
- Cancer
- Accidents (AKA unintentional injuries)
Back in 1973, the list looked almost identical, except stroke held the number three spot, and accidents came in at number four.

What fascinates me is the massive contraction in heart disease deaths from 38% of all deaths in 1973 to just 22% in 2023. In raw numbers, that’s a decline from 244 deaths per 100,000 people to 161. Cardiology has quietly pulled off a quiet revolution.
But when we add years to life, something else has to fill the gap. With life expectancy up about seven years since 1973, cancer now has more time to do its work.
Meanwhile, accidents have been creeping upward, which feels counterintuitive. Shouldn’t better technology and stricter laws have reduced accidental deaths by now. Especially given that accidents are the leading cause of death for people ages 1–44? That question pushed me deeper.
The Shifting Face of Death Due to Accident
From 1907 through the early 1990s, accident-related death rates fell steadily. Then progress stalled—and since the 2000s, the trend has actually reversed.

The culprit is clear: overdoses. Opioids like fentanyl, along with stimulants such as cocaine and meth, now drive much of the increase.
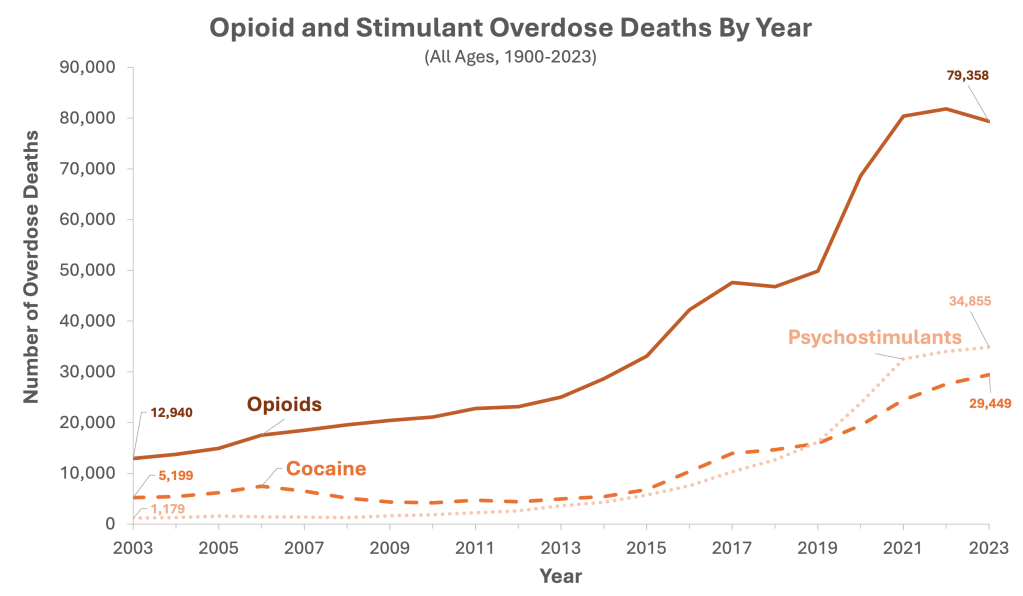
In fact, the ripple effect of the opioid epidemic shows up directly in the accident mortality curve. At a glance, the overall death rate from accidents is about the same in 1973 and 2023 (~60 per 100,000). But the details tell a different story:
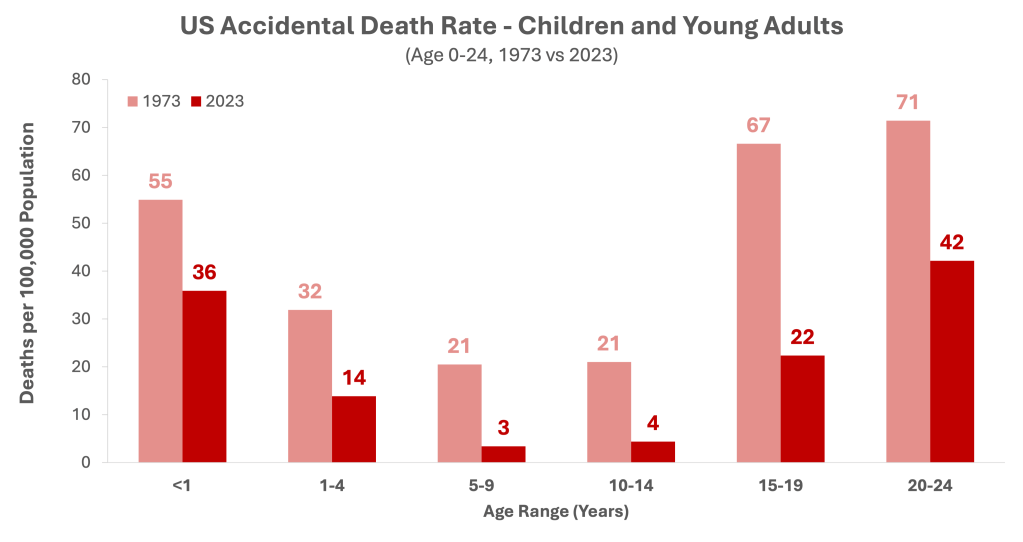


Looking at comparison of the CDC accident mortality data from 1973 and 2023 (shown above) we see a pattern:
- Children and young adults (0–24): Accidental death rates have declined sharply
- Working-age adults (25–64): Rates have increased substantially
- Older adults (65+): There’s been modest improvement

When we break down the causes of accidental deaths by age, some striking patterns emerge. In early childhood (0–4 years), most deaths fall into the “other” category, since the big three, motor vehicle crashes, overdoses, and falls, are less relevant at that age. By the teenage years, however, motor vehicle crashes dominate, peaking around ages 15–19 when many young people are first learning to drive. Overdoses begin to take over in early adulthood, becoming the leading cause of accidental death by the late 20s and peaking at ages 35–39, when they account for more than 70% of accidental deaths. From there, overdose deaths gradually taper off, while falls steadily climb and eventually take the top spot in the 70s and beyond. Anyone who has cared for an older relative knows how devastating a fall can be. What we shrug off in youth can prove life-altering, or even fatal, in older age.
Childhood and Adolescent Accidents: A Different Story
Here’s the good news: the absolute number of accidental deaths under age 20 is now about one-third of what it was in 1973, even before adjusting for population growth. That decline shows up across nearly every age bracket.

What’s driving the shift is very dependent on age:
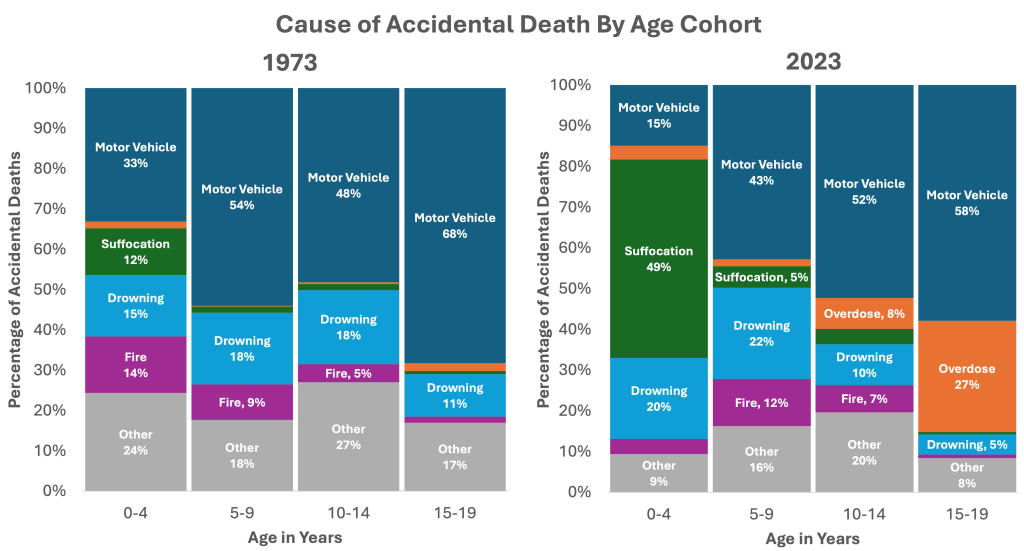
So what changed? A few trends stand out:
- Motor vehicle deaths are way down, across nearly all age groups.
- Overdoses are up, even in adolescents.
- Suffocation deaths rose in the 0–4 age group—though classification changes likely play a role.
- Fire deaths fell sharply among young children.
- The catch-all “other” category shrank, meaning many small accident risks have improved.
The motor vehicle death improvements are to be expected. Regardless of the metric for death rate used: population or miles traveled; death rates have declined.
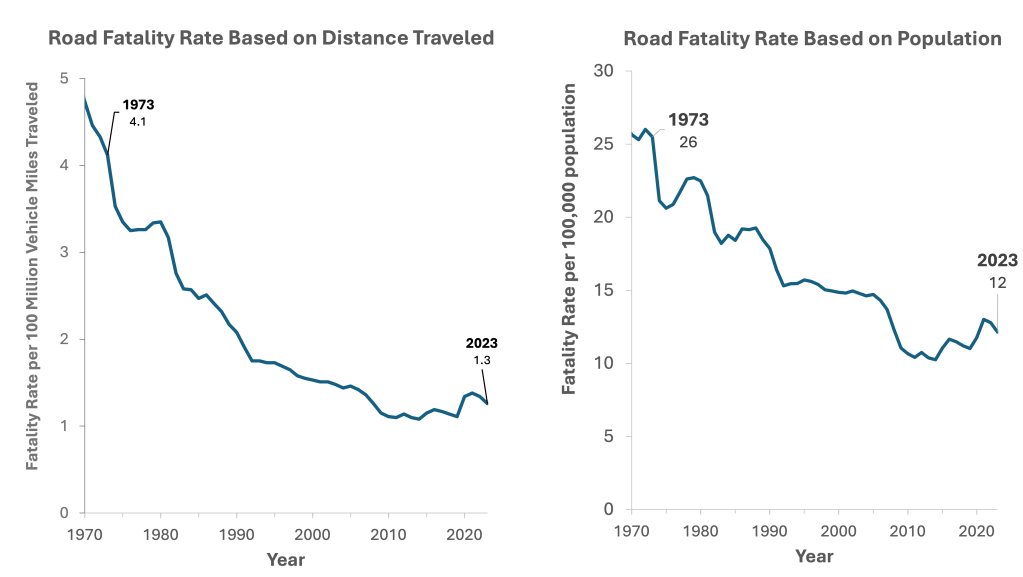
Seatbelts, airbags, fire safety campaigns, and safer cribs clearly deserve some credit. But the suffocation numbers deserve context: what we now label as “Sudden Unexpected Infant Death” (SUID) was still poorly understood in 1973. As investigations improved starting in 1996, some deaths previously coded as SIDS were likely reclassified as suffocation. Overall SUID rates have fallen since the 1990s, even if the subcategories shifted.
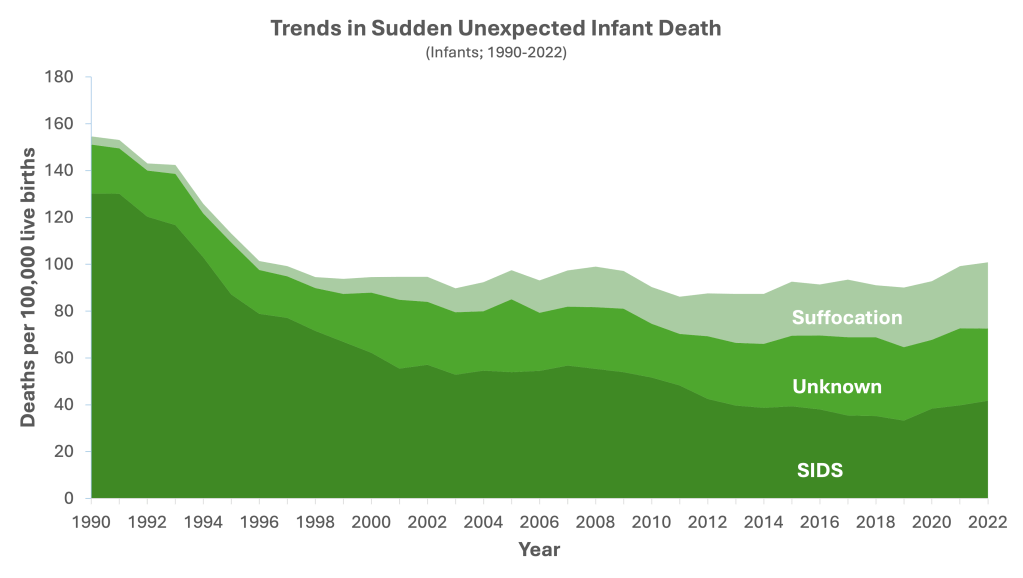
Despite these overall improvements, many clinicians remain concerned about the apparent rise in SUID deaths since 2018—particularly because many of these tragedies can be prevented with safe sleep practices recommended by the American Academy of Pediatrics.
You’ll Never Be Bitten By a Shark If You Don’t Go to The Beach
I’ve never been a fan of shark bite statistics. Too often, they’re presented by dividing the total number of U.S. shark bites by the entire U.S. population. On the surface, that sounds reasonable, but it treats someone standing in an Iowa cornfield as if they face the same risk as someone swimming in shark-infested waters. Risk should always be calculated for the population actually exposed; otherwise, we end up with misleading conclusions—like assuming infants are overdosing on opioids, which the data above clearly shows is not the case.
Additionally, some risks vary with seasonality. Take drowning deaths, for example:

Year after year, drowning deaths reliably spike from May through August in the United States, a period that lines up neatly with pool openings across the country. This highlights an important point: for an activity to cause a meaningful number of deaths, it doesn’t just need to be risky; people also have to be doing it. Riding on top of a subway car is almost certainly riskier than driving, but the reason we don’t see many subway-top fatalities is simple:
- Most of the country doesn’t have a subway system.
- Most people ride inside the subway car, not on top of it.
So while I’d love to conclude that the safety gains of the past 50 years are purely a result of better design and smarter regulation, we can’t ignore that what I’ve shown here is still correlation. I think my assumptions are reasonable, but there may be confounding factors I haven’t considered (and I’d love to hear thoughts in the comments).
Part of the broader social critique is that kids today are so sheltered they never take risks, and their lives are over-managed. Historian Rutger Bregman argues, both in the press and in his books, that children need the freedom to explore unstructured play in order to build independence. He makes the case that children are often more cooperative, smarter, and kinder than adults give them credit for. Expecting them to be selfish, greedy, or foolish becomes a self-fulfilling prophecy.
In the end, it’s all about balance. Car seats, seat belts, safe sleep practices, and pool gates make sense. But if you’re worried about protecting your kids from shark attacks in Iowa, it might be time to ease up.
Safer Cribs, Riskier Midlife
Perhaps, though, it’s the adults who need to start worrying about ourselves. While accidental deaths in children have fallen sharply over the past fifty years, deaths among prime-age adults have surged—driven largely by overdoses. Kids today may be safer in their cribs, cars, and backyards, but it’s the adults who seem to be struggling. There are no easy answers here. But it’s worth remembering that in 1990 we faced another hard problem: SIDS. Over two decades of steady research produced evidence-based strategies that saved lives. Even as public health infrastructure frays, private efforts like the Foundation for Opioid Response Efforts can help fill the gap. Kids are great, but our concern shouldn’t vanish once they turn 21.
As for swimming in five-gallon buckets? These days the water barely covers my shins, so most of the fun has worn off… but at least I’ve aged out of the at-risk category.
I’m experimenting with the direction of this blog, so I’d really value your feedback; especially since this post is a bit outside my usual fare. If you enjoyed it, give it a like and consider subscribing to the email list. And if it didn’t land, tell me why in the comments. I’m looking for radical candor, so don’t hold back.
Discover more from The Retro Scientist
Subscribe to get the latest posts sent to your email.

Your pictures didn’t come through. Sent from my iPhone
LikeLike
Well that’s suboptimal… thanks for letting me know!
LikeLike
When I first started reading this blog, I thought that it might show a correlation between increased accidents and all the extreme stunts that seem to be prevalent on some social media platforms.
Unfortunately, I’m saddened but not surprised to see that drugs are a problem for so many who are definitely old enough to know better.
It was a good read. I enjoyed it.
LikeLiked by 1 person
Thank you so much! I’m glad you enjoyed it.
LikeLike